- Introduction
1.1. The goal
The aim of this guide is to acquaint users with the individual settings and possibilities of using the CitySys platform.
1.2. Track changes
| Version | Last Change Date |
|---|---|
| 1.003 | 2022-02-01 |
1.3. Concepts, abbreviations and symbols
| The concept | Meaning |
|---|---|
| EDB | Electrical Distribution Box |
| PL | Public lighting |
1.4. Advantages / principles of the platform
CitySys is an open platform integrating multiple applications that make up a smart city. The collection, transmission and evaluation of data is provided by the comprehensive CitySys control system based on the ThingsBoard IoT platform according to the OPC standard. Open Platform Communication (OPC) is a series of specifications from software vendors and developers that define the interface between clients and servers, including access to real-time data. Its hardware component provides direct connection via standard interfaces and protocols. When it comes to connecting to third-party systems, and therefore also to current systems, CitySys is open to communication. The collected data is stored on a cloud server. The CitySys IoT platform brings many interesting benefits that can help the customer to decide on the integration of intelligent technologies. The platform is horizontally scalable and is built using “open-source” technologies. It can fully tolerate errors because all nodes in the cluster are identical. Its really strong advantage is robustness and a high degree of efficiency. This means that every single node can control tens of thousands to hundreds of thousands of devices. The platform has customizable web tools (widgets), rule processing and a system for plug-ins (plugin), thanks to which it has really great extensibility options. We live in a world in which every system and every city has security integrated within its scope. The platform supports transport encryption and authentication of the credential management device. Big data is collected in Smart City through a number of sensors that monitor various parameters. These include many interesting sensors, such as motion sensors, traffic sensors, parking space occupancy sensors, weather stations, waste management sensors, noise sensors, shooting sensors, a camera system and emergency buttons. All of these devices can be implemented directly into the luminaire or can form part of a Smart Pole street lighting pole. The platform is horizontally scalable and is built using open source technologies.
2. Access to the system
Access to the server is performed via a web interface / application – CitySys at the URL:
The actual URL of the system may differ from the above based on customer requirements. Before logging into the system, it is necessary to make sure that access to the platform has been correctly established and set up (delivery of login data). On the home page, the user is prompted to authenticate with a username and password. The system allows you to define multiple users, each with different rights and permissions. User creation and management is provided by the system administrator. If you do not have access data, contact the solution provider.
Communication and transmission of information between the EDB and the platform are secured by encryption. The system is accessed and monitored via 128-bit encrypted communication from anywhere with a computer or tablet connected to the Internet.
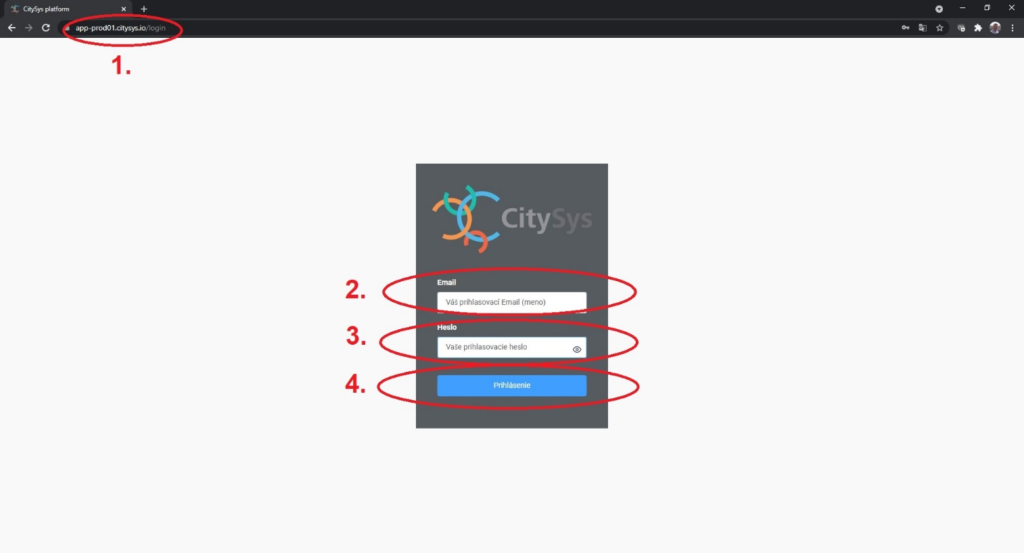
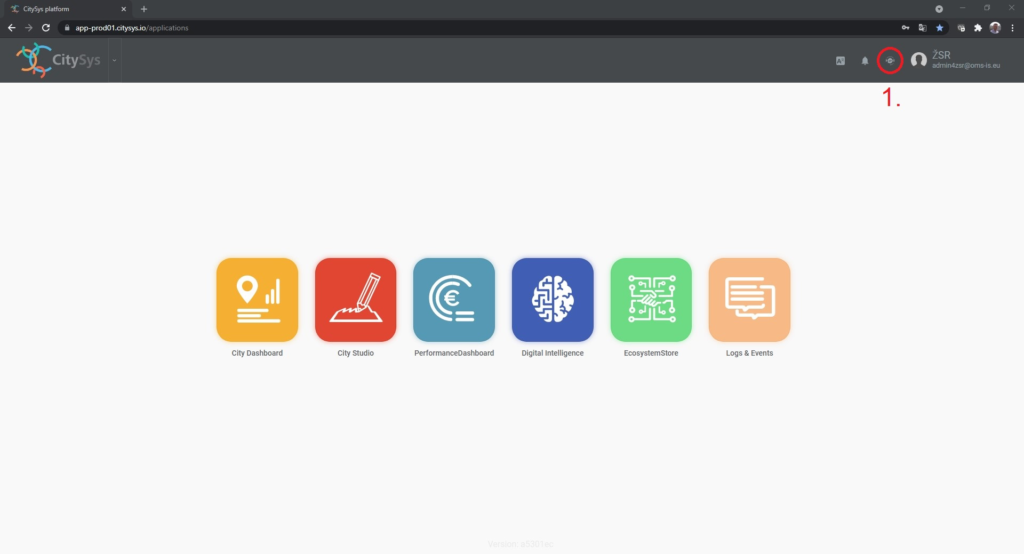
2.1. User login
1.) Enter the appropriate URL of the CitySys control system into the search engine: https://app-prod01.citysys.io 2.) Enter your own (assigned) email in the “Email” field. 3.) Enter the password in the “Password” field. 4.) Confirmation of login to the CitySys system.
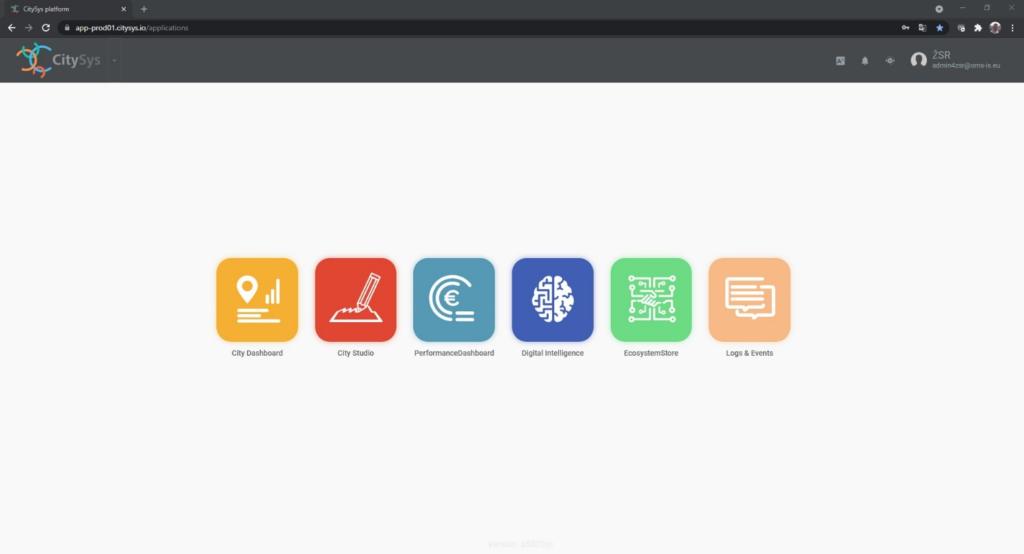
5.) The user is logged in to the CitySys control system.
2.2. User logout
1.) Click on the logged in user in the upper right corner to open the menu with the menu. 2.) Option to log off the user.
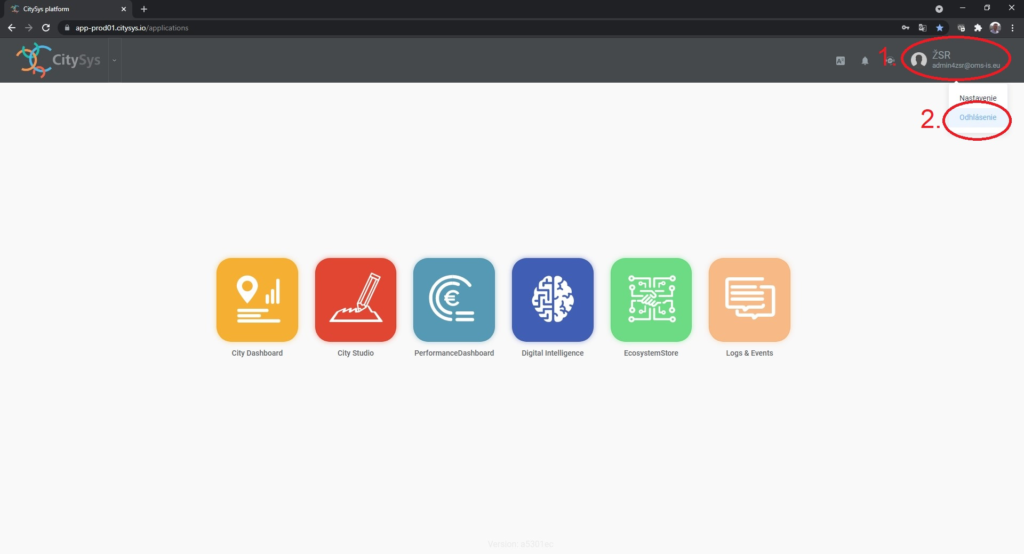
3.) The user is logged out of the CitySys control system.
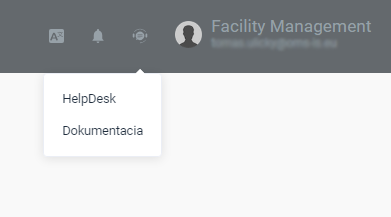
2.3. Access to support – Help Desk
1.) Clicking on the HELP DESK icon in the upper right corner will redirect you to the support page.
- HELP DESK will redirect you to the support page.
- After selecting it, the documentation will be redirected to the CitySys manual
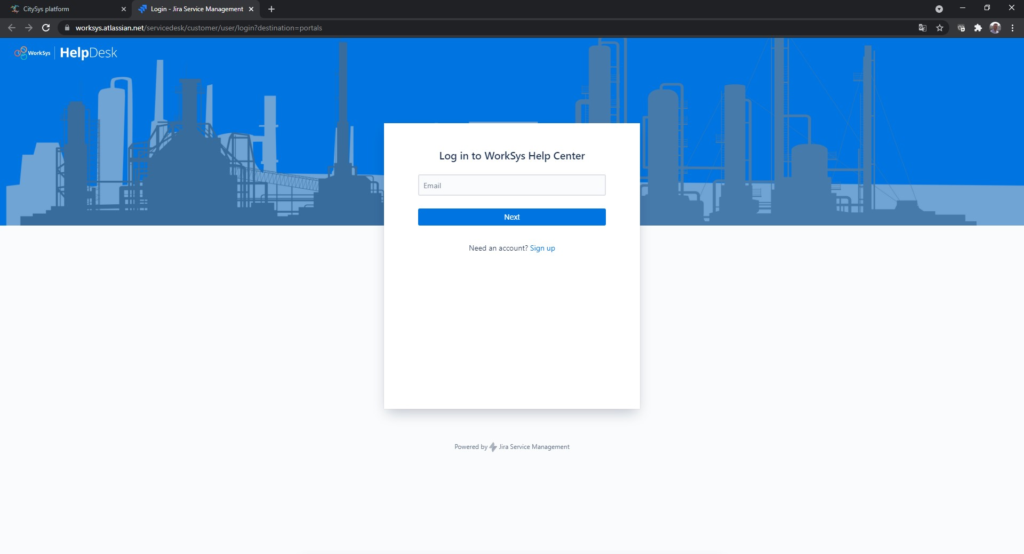
2.) After opening the HELP DESK page, enter your login details needed to enter the system (if you do not have them, they will be provided by the system supplier).
2.4. Welcome display
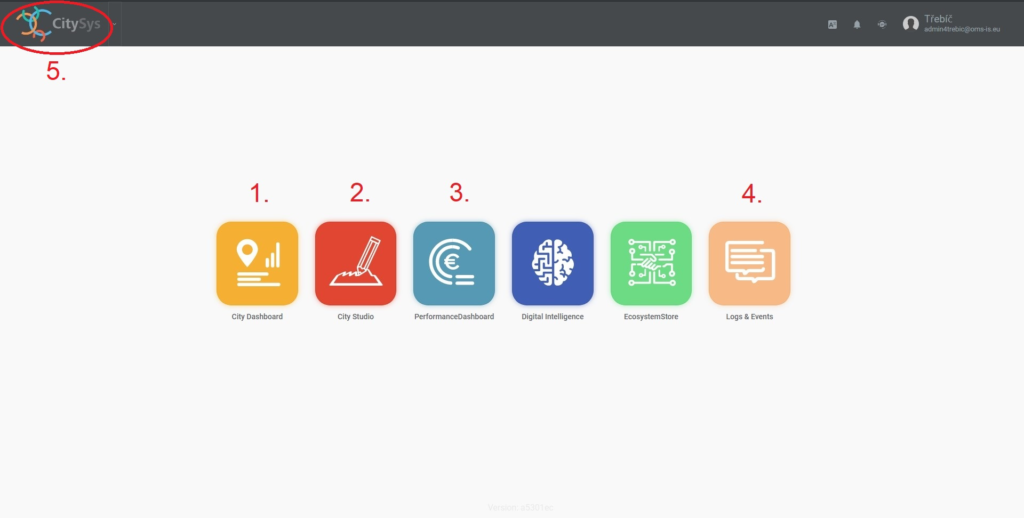
2.4.1. Available icons and applications
Icons with available applications are located below the top bar on the home screen.
1.) City Dashboard – basic application with map overview and current information about devices. 2.) City Studio – application for creating / editing platform elements such as regions, zones and devices. 3.) Performance Dashboard – analytical tool for graphical monitoring of data from devices. 4.) Logs & Events – application for visualization of logs and notification of events from devices.
The display of icons is subject to user privileges and may not be visible to all users. Contact your system administrator if you need to change permissions. For a faster transition between applications, it is possible to use the drop-down menu, which is activated by clicking on the arrows next to the CitySys logo on the top bar (upper left corner):
2.4.2. Available icons
The logo and the mentioned navigation menu are accessible from all levels of the system. In the right part of the top bar there are system settings, which are also available from all levels of the system:


3. City Dashboard user interface
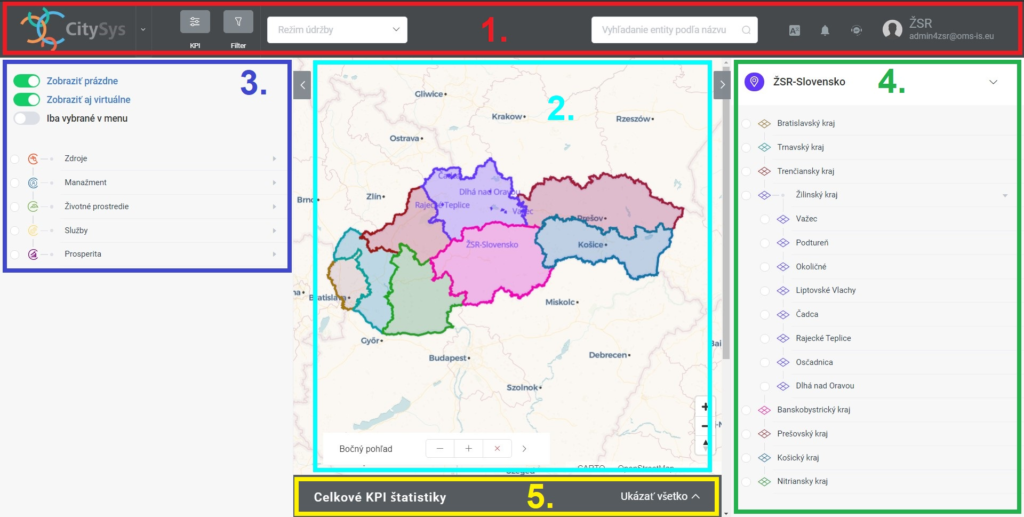
The user interface application includes the visualization of platform elements (devices, zones, regions) on a map base. In addition to devices such as EDB and lighting, it is therefore possible to visualize areas such as regions or municipalities. The user interface consists of five parts:
- Elements on the top bar
- Map base
- Left menu (Tree of device types by individual areas)
- Right menu (Organizational structure of objects / Equipment tree / Equipment detail)
- Statistics and KPIs
3.1. City Dashboard – elements on the top bar
By activating the CitySys Dashboard application, additional icons will be added to the top bar, which are used to operate the application.
3.2. City Dashboard – map base
The map base is used for basic visualization of the location of regions, zones and facilities. The position on the map base (using GPS coordinates) defines the position of the element. You can enter a position as a polygon (typically regions and zones) or as a single point (typically a device). However, it is also possible to enter the device itself as a polygon (area on the map). If the device is a location on the map as a point, it is displayed by its specific icon, which is defined within the device type (entity type, entity type). The icon cannot be changed by the user, but the user can specify the color of the icon (fill color) when creating the device. The list of icons is expanding dynamically and is therefore not part of this document. The display of elements on the map base is conditioned by filters:
- filter of regions and zones (right menu)
- device type filter (left menu)
- combined filter (Filter menu)
- conditional staining filter
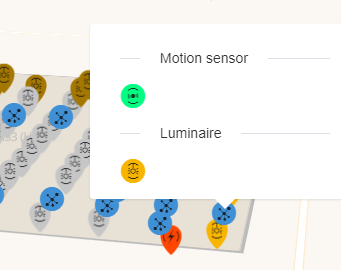
By activating / deactivating individual filters, the current display of elements on the map is dynamically adjusted. Using the + / – buttons or the mouse wheel, the map base can be zoomed in and out. By simultaneously holding down the CTRL key and the left mouse button, it is possible to change the tilt of the map view by dragging on the map base. Clicking on a specific element on the map (region, zone, classification) will display its detail in the right menu and at the same time the icon of the selected device will start moving. If the map zoom setting causes the icons to overlap (the icons do not change their size when the zoom is changed), a cluster of devices will be created. Click on the grouping icon to display a window with a list of devices inside the grouping.
The left menu or the Device type tree serves as a graphically controlled filter of devices displayed on the map base. At the top level (collapsed list), device categories are shown. Expand a category to see it below the category, and then specific device applications (such as Lighting). Each list item has a box to activate the filter. Activating / deactivating a higher-level item also activates / deactivates all of its nested items. At the top of the menu are switches that filter the list of categories itself:
The current state of the filter directly affects the display of devices on the map. If no device category is active, no device is displayed on the map. The filter settings in the left menu are also dynamically transferred to the filter settings within the Filter window. When you expand the list of categories to the lowest level, each item has an eye pictogram. When clicked, the conditional color setting of the device type is displayed according to the value of the selected attribute (for example, device status or lamp brightness). Conditional coloring allows for quick visual inspection of device parameters. Attributes of devices that support conditional coloring are defined by the system administrator and are subject to change. Therefore, they are not part of this document.
The right menu has several functions. When you open the City Dashboard application, it shows the Organizational structure of regions and zones. After selecting a specific zone, it displays the Device Tree in that zone. When selecting a specific device (on the map base, in the device tree or in the search), the detail of the given device is displayed in the right menu. The buttons at the top of the window are used for navigation within the right menu:


3.5. City Dashboard – KPI
The KPI (Key Performance Indicators) window is used to quickly create a graphical representation of the recorded data for analysis over time or for comparison with other data. KPIs are personalized for a given user, so each user can have a different display of graphs in the KPI – according to his user settings. The KPI window is displayed by activating the corresponding icon on the top bar or the icon at the bottom of the screen (Show all). At the top of the window is a filter for displaying already created KPIs, which is useful if multiple graphs are created. Depending on its configuration, it may take more than half a minute to load the graph. On the right is the New KPI button to create a new chart.
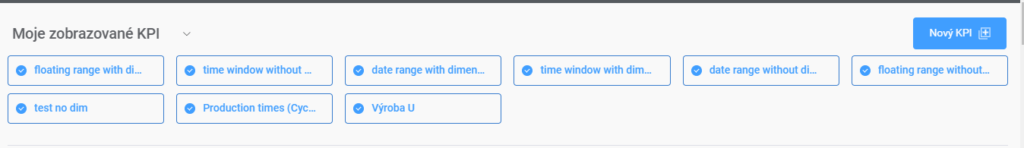
Within the KPI, it is also possible to go directly to the panels from the Performance Dashboard application. By scrolling with the mouse wheel, it is then possible to scroll through the individual graphs.
3.6. City Dashboard – Filter
The Filter window is activated using the icon on the top bar. Represents a direct filter setting for displaying objects on a map base. If the filter is active, this is indicated by a blue dot next to the icon on the top bar:

The filter settings are also dynamically controlled by activating the graphic elements in the left and right menus as already described.
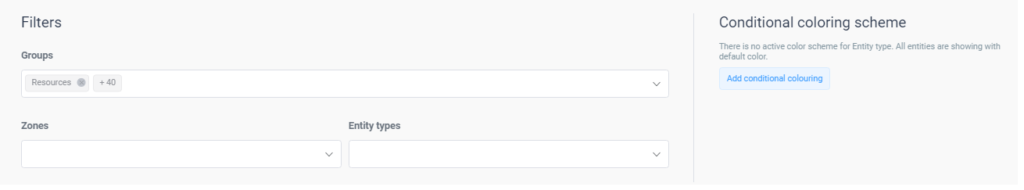
| Groups | Device category – contains all categories and under device categories (input from the left menu). |
| Zones | Filter to the location (zone) in which the device is located (input from the right menu). |
| Entity types | Setting a specific device type (entity type). |
Within each parameter it is possible to combine several conditions (ie more groups, zones and types of devices). A special type of filter is conditional coloring, the setting of which is located in the right part of the window. Click the Add Conditional Color button to display the settings window.
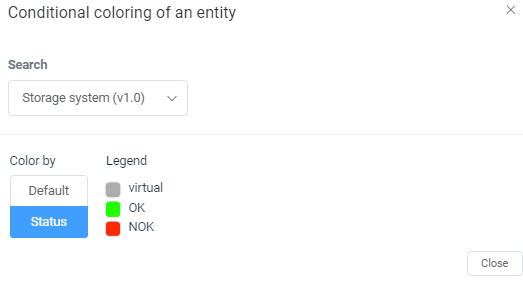
To activate conditional coloring, it is necessary to select the device type (entity type) and the attribute according to which the coloring will be performed. The legend also displays the assignment of colors to the selected states or values. If the attribute has a value that is not in the legend, this device will be colored according to the device definition (as if the filter was not active). Conditional coloring can be set for each device according to only one attribute.
3.7. City Dashboard – Maintenance mode
The CitySys platform is in a default monitoring mode. This means that it is not possible to influence the status of the devices and their configuration. The Maintenance Modes radio button allows you to turn on the active mode for the selected device type. A typical example is lighting control CitySys application – Public Lighting. Maintenance mode access settings are controlled by the system administrator, and each user who wants to be able to use maintenance mode must have permission to do so (assigned to a specific user). Therefore, the display of maintenance modes is different for users with different permissions.
3.8. City Dashboard – Watchers
The Watchers menu is used to set an watcher that monitors the selected parameter of the selected entity (device) over time. If the conditions for triggering an watcher in the given time window are met, a window with information about the triggering of the watcher will be displayed. At the same time it is possible to set the sending of notifications by e-mail or via SMS (Chapter).
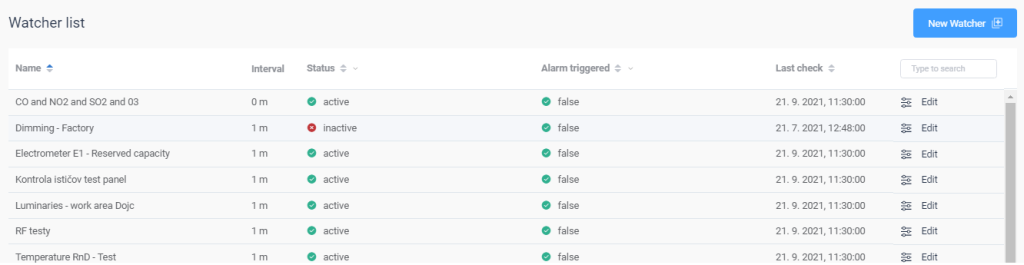
It is possible to see in the list of created watchers:
| Name | User name for the watcher. |
| Interval | Time interval within which the watcher conditions are evaluated. |
| Status | Information on whether the watcher is active. |
| Watcher triggered | Information on whether the condition for triggering the watcher is currently met. |
| Last check | Date and time of the last watcher condition check. |
Use the New watcher button to create a new watcher. After activating it, a dialog box for entering the parameters of the new watcher will open.
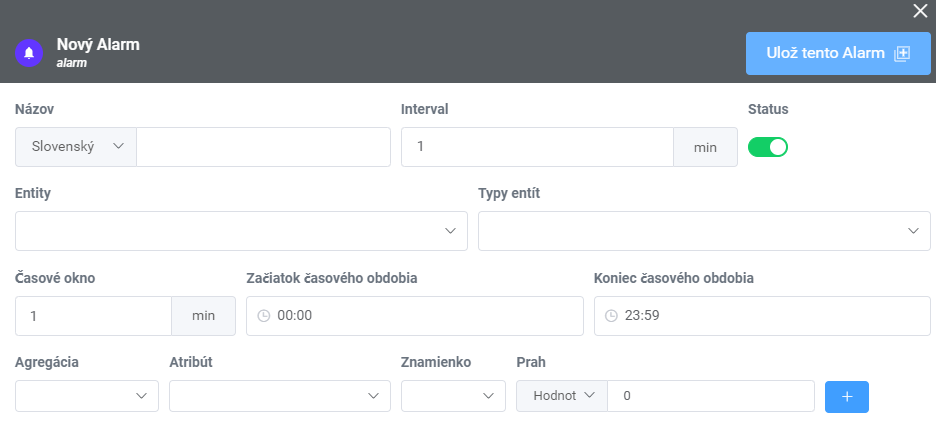
The table below describes the watcher parameters:
| Name | User name for the watcher. |
| Interval | Time interval within which the watcher conditions are evaluated in minutes. |
| Status | The switch that activates or pauses the watcher. |
| Entities | The device to which the watcher applies. You must select an entity name. |
| Entity types | The type of devices to which the watcher applies. |
| Time window | A time interval that determines how long into the past the watcher condition will be evaluated. For example, a time window of 10 minutes means that the watcher will be triggered if the watcher conditions have been met within the last 10 minutes. Thus, up to 10 minutes after the watcher conditions are no longer met, the Watcher Status will change to not triggered. |
| Start/ End Time range | The start and end of the time period determine when the watcher will be active during the day. Only one period can be set. |
| Agregation | The aggregation function defines the method of data processing within the time window. Within numeric attributes, the functions: Average, Sum, Minimum and Maximum make sense. For example, the average function calculates the average value of an attribute within a time window and evaluates it against an watcher condition. For status attributes (text strings), only the Last Value function makes sense. |
| Atribute | Parameter which value is considered as an watcher condition. |
| Condition | Operator conditions. For non-numeric attributes, only the equal or unequal operator makes sense. |
| Value | Parameter value type – value or date. |
| Value field | Place the value with which the selected attribute will be compared. |
| + | Button to add another attribute. The results of the comparison of individual attributes are logically multiplied. Therefore, the conditions of all attributes must be met to trigger the watcher. |
An already created Watcher can be edited using the Edit button in the watcher table.
4. City Studio editing interface
The City Studio editing interface is used to create and edit objects on the CitySys platform. As it is a configuration interface, its use is not intended for the average user, but for a trained person with a deeper knowledge of the CitySys platform. Therefore, only the basics will be described in this guide. Contact your system vendor for a more detailed description of the City Studio interface.
After opening City Studio, the icons associated with editing the environment will be displayed on the top bar:


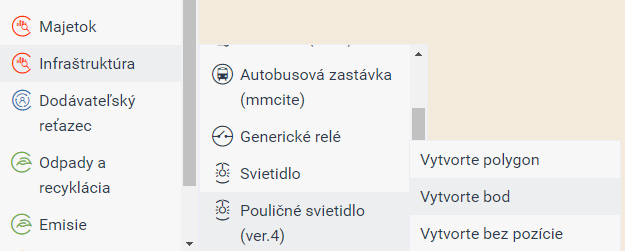
Regions and zones are defined as polygons on a map base. Within the right menu it is possible to see the tree structure of regions and zones. Within their definition, the title (also for various translations) and color are entered. For zones, you can also specify a level for multi-storey objects. When activating the interface for working with devices, the left menu is also displayed – a list of devices in a tree structure by category. In the right menu there is a complete list of objects in the tree structure for the selected region (selected region, zones and facilities). To create a new device, first select the zone or device to which it will belong (right menu), then its category and select the device type from the open list. Then you need to choose whether the device will be a polygon, a point, or will be without a position on the map, and finally place the device on the map base.
This is the device created in the database. For the correct function, it is still necessary to pair the created device (entity) to a specific real HW. This is done through the TB identifier parameter, which is located in the detail of each device (pencil icon in the right menu). The detailed description of pairing depends on the type of device and is beyond the scope of this manual. Contact your system vendor for more information.
5. Performance Dashboard analytical interface
The Performance Dashboard analytics interface is used to create graphs and statistics for the analysis of data collected from devices. The interface consists of individual boards that group graphs according to user preferences (typically they can be boards for different applications, different buildings, sections of the system). Boards can also be connected to the KPI statistics interface on the City Dashboard and shared with other users.
5.1. Create new board
Use the button with the same name to create a new board. The board is defined by the following parameters:
| Language | Option to select the language in which the name will be |
| Name | Username for the given board, it is possible to enter various translations. |
| Groups | Assign a board to a device category. The panels you have in the Performance Dashboard in the left part of the menu. |
| Description | A place for a user description of the board, including possible translations. |
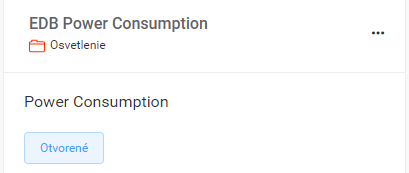
Confirm with the Save board button to create a new board, which will then be displayed between the boards. You can display a specific board by clicking the Open button. Editing a given board is possible via the three dot icon in the upper right corner of the board object.
After creating the panel, it is possible to click on the three dots in the upper corner of the panel to select the Edit option in which you can edit the saved data but also share the chart with other platform users. When you select View option, users will only be able to see the graphs, and when you select Edit option, users will also be able to edit the graphs.
After opening the panel, there is an interface for working with the panel at the top of the window:

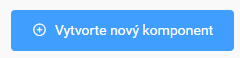

5.2. Create new Component
To create a new panel component, you need to define it. The parameters of the component are:
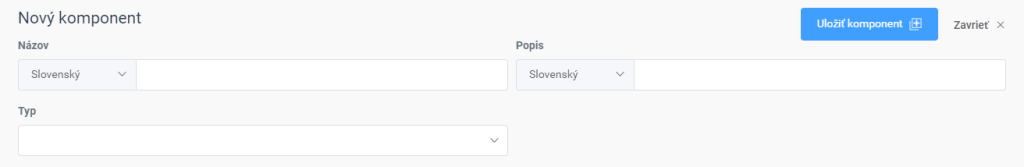
| Name | Username for the given component, it is possible to enter various translations. |
| Description | Space for user panel description including possible translations (can be left blank). |
| Type | Component type – KPI or static object (text, image, video). |
When choosing the type of component, the most important type is KPI, which is the subject of the next chapter. In the KPI menu, it is possible to select already created KPIs by name, while in parentheses after the name you can see where the KPI was created (within the City Dashboard or Performance Dashboard application). You can create a new KPI by clicking the + button. Clicking on the arrow to open the left menu will display a tree of device categories for filtering panel components and individual KPIs according to the assigned group.
5.3. Create new component Type: KPI
Within the CitySys platform, KPIs can be considered as a separate object, with which it is possible to work in different places of the platform. Also, the creation of KPIs is possible from several places – within the City Dashboard or Performance Dashboard application. However, both sites lead to the same dialogue of creating a new KPI.
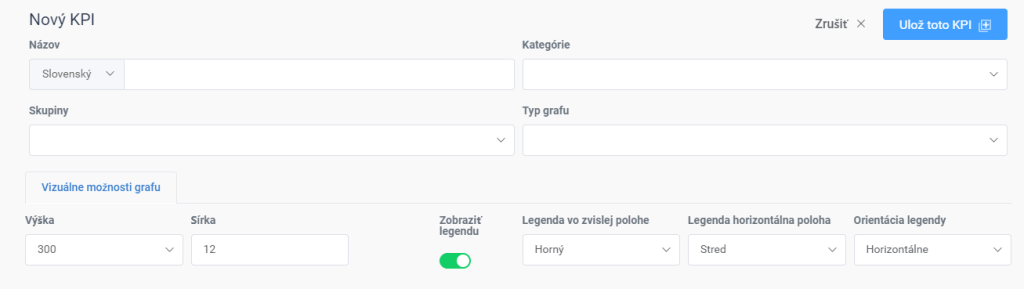
| Name | Username for the given component, it is possible to enter various translations. |
| Category | KPI category – status or other (time courses). You select the status in case you want to create a graph to check the status of the device / devices |
| Groups | Assign KPIs to device categories. It is advisable to determine the category as accurately as possible in order to always display the most accurate data. |
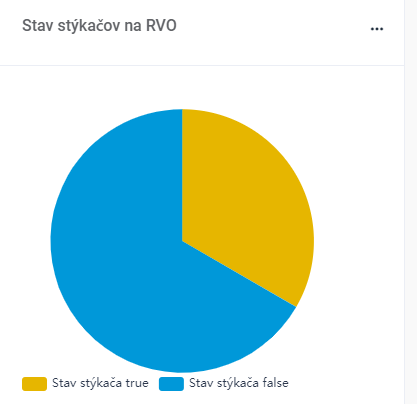
| Chart type | Graph type selection: between pie, alarm and time graph. |
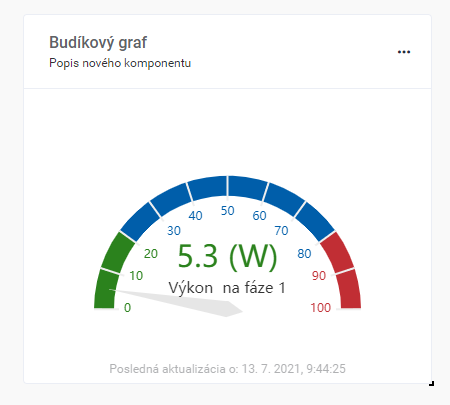
For the KPI category, it is important to select the other option if it is a display of an attribute with a numeric value. The figures below show different types of graphs for illustration. The pie and gauge graphs do not work with a time interval. Gauge chart:
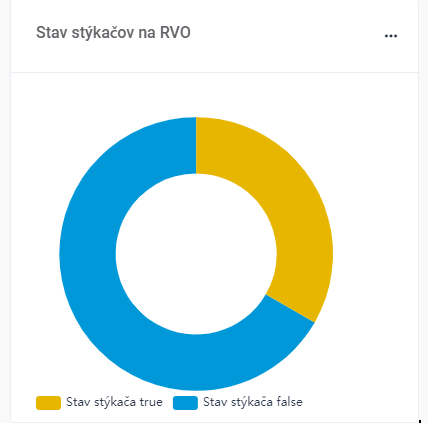
Pie charts (left visualization cone – donut, right pie – pie):
Time scale chart (bar top, bar bottom):
At the top right of the chart, you have three icons:


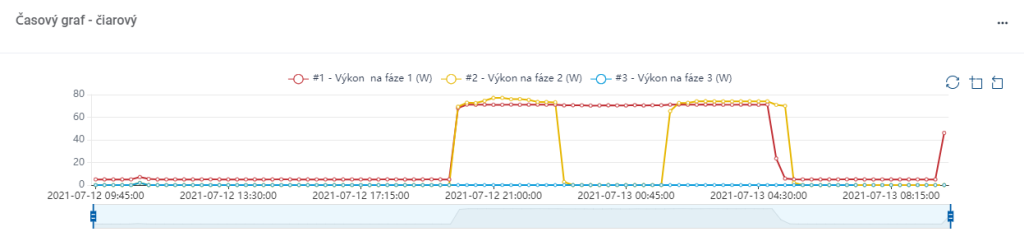
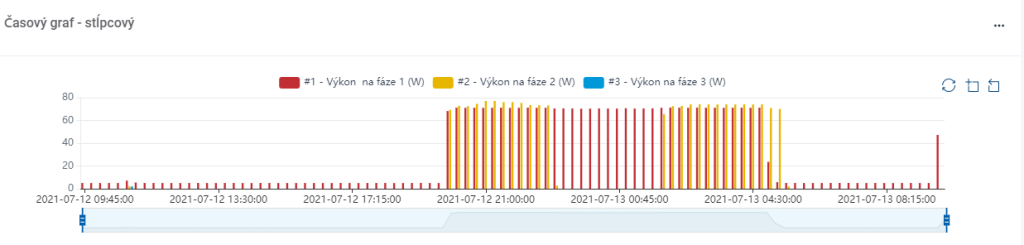
Table:
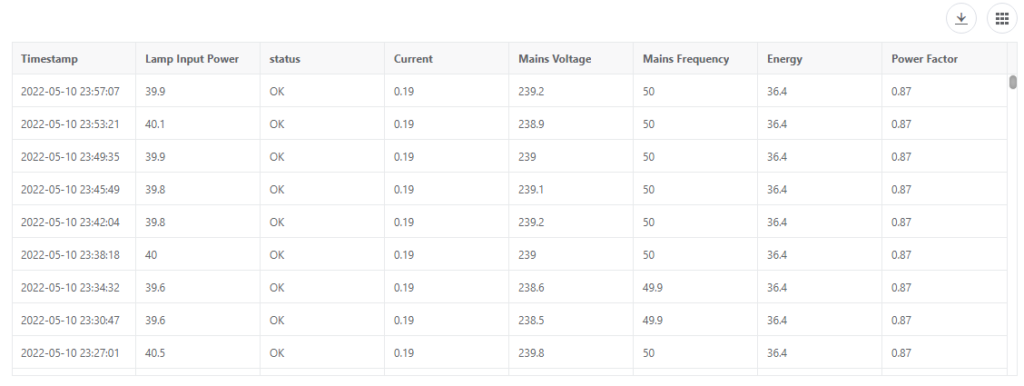


Table export:
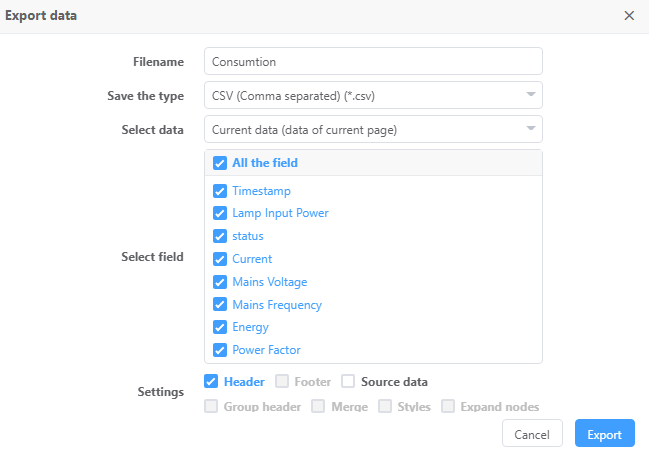
| Filename | the name of the file under which the table will be saved |
| Save the typ | selecting the save type as either .csv or excel file (.xlsx) when selecting excel you will be able to set the sheet name in excel |
| Select data | selection of current data |
| Select field | select the parameters you want to export |
| Settings | the file can be exported with a header or as source data |
The next part of the settings are the visual options of the graph:
| Height | Graph size – height. |
| Width | Graph size – width. |
| Show legend | Legend display switch. |
| Legend vertical position | Select the position of the legend in the vertical axis – up, center, bottom. |
| Legend horizontal position | Select the position of the legend in the horizontal axis – left, center, right. |
| Legend orientation | Rotate the legend – horizontally, vertically. |
Specific chart type options are also available for the time and alarm chart type. The specific options for the time scale chart are:
| Aggregation interval | This is the time period within which the data is processed into the graph. For example, aggregation functions are applied within a time interval, or bar graphs are plotted accordingly. Represents the time granularity of the graph. It is true that the shorter the time interval, the more time-consuming the processing of the graph. |
| Time window | Represents the width of the graph in units of time. This is the range of data that the graph will display. The time window is dynamic – its end is always the current time. For example, a time window of 3 hours displays data for the last 3 hours. |
| Number of decimals | Setting the display of decimal places. |
| Visual mapping | Adjust colors according to values. |
Specific options for the Gauge chart are:
| Minimum | Alarm chart range – start. |
| Maximum | Alarm chart range – end. |
| Number of decimals | Setting the display of decimal places. |
| Number of segments on axis | Setting the number of parts on the alarm chart. |
| Gauge coloring | Adjust colors according to values. |
Specific options forTable:
| kpi.pageSize | Specifies the number of table values |
| Date range | Select a time range of values in the table |
| Entities | Device selection, data source. It is possible to select more subjects, but the aggregation function is applied to all subjects – for example, data from all subjects are averaged over a time interval. To select an entity, you need to know its name. |
| Entity types | Device type selection (entity type). The entity type filters the attributes to display only for the options of that entity type. |
| kpi.fields | Selection of the type of measured parameters to be displayed in the table |
| kpi.selectAll | Selection of all possible measured parameters from the selected subject type that can be displayed in the table |
| kpi.clearAll | Clears all selected parameters in kpi.select |
After setting the visual options of the graph, it is possible to add the source data for the graph (series). Multiple data series can be added to one graph. Use the + button on the top right.
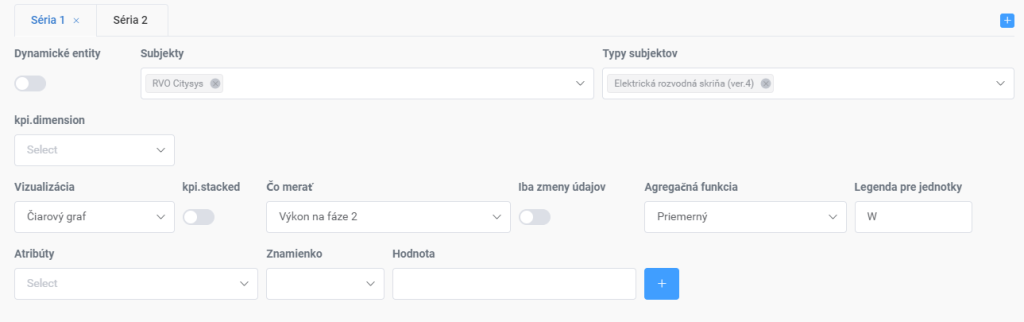
| Dynamic entities | They allow you to dynamically select the devices to which the graph applies – by selecting in the right menu (zones, regions). Can only be used within the City Dashboard application. |
| Entities | Selection of the device to which the series relates – data source. It is possible to select more subjects, but the aggregation function is applied to all subjects – for example, data from all subjects are averaged over a time interval. To select an entity, it is necessary to know its name. |
| Entity types | Device type selection (entity type). The subject type filters the attributes to display only for the options of that entity type. |
| Dimension | A specific parameter that allows you to select the time unit for layering graphs. |
| Visualization | Graph subtype selection (line / bar for time graph, pie / cone for pie graph). Only the alarm clock type is available for the alarm chart. |
| Stacked | Graph layering activation switch |
| Measure | Select the device parameter to be displayed in the graph |
| Only data changes | The switch activates the rendering of data that has been received without interpolation. (Takes only values from selected data that have been modified after the update) |
| Aggregation function | Select a function to be performed with values within the selected time interval. Available are: average, minimum, maximum, sum, last value. |
| Legend unit | Specify the unit to display in the legend. Pre-filled based on device type definition. |
At the bottom of the series settings, it is possible to define the conditions for plotting the graph. The parameters of the condition are:
| Attribute | A parameter that enters a condition and is compared to a value |
| Conditions operator | Conditional operation: smaller / larger, smaller / larger or straight, straight, is part of the interval .. |
| Value | The value to which the attribute is compared |
It is possible to create more conditions – add via the + button at the bottom of the window.
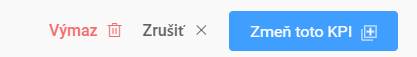
In the upper right corner of the window for creating KPIs there are buttons for saving KPIs or cancelling changes, or deleting it (when editing).
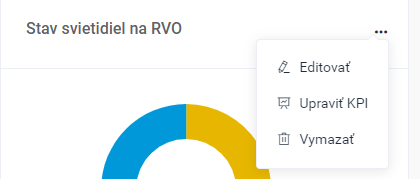
If editing of panel components is enabled using the Edit button, it is possible to move and resize individual components within the panel (by dragging the edge of the component). In the upper right part of each component there is a menu enabling editing of the component and KPI, or deleting the component.
5.4. Create new component Type: Image
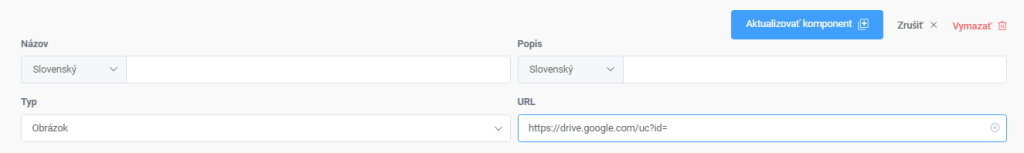
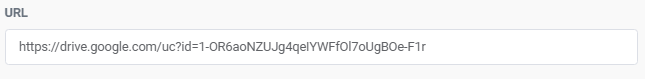
When creating a new component Type – image:
- You need to save the image to google drive first then
- Copy this part of the link to the URL first: https://drive.google.com/uc?id=
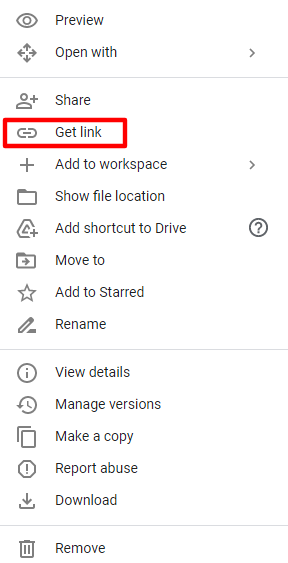
3. On google drive, click on the image you want to get to the platform, right-click and select get link
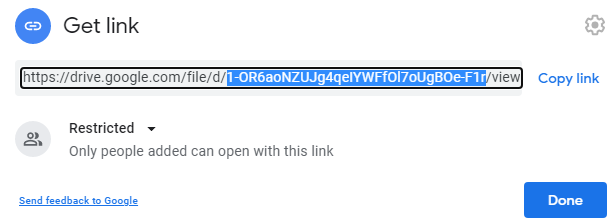
4. copy the name of the image, which is located in the area marked in the image below
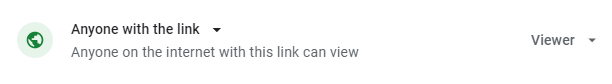
5. You must then allow who the image will be able to watch for. Anyone with the link
6. Add the copied text to the URL of the previously pasted text and save the component
7. Then you just have to click to save the component
5.5. Create new component Type: Iframe
As with image creation, now that you select the Iframe Type, you need to specify the page from which the video will load. If you want to get video from youtube to your platform, you must select the Iframe type.
- On YouTube, select Share for the video you want to use
2. After opening the Share option, select the first embed window shown in the image below
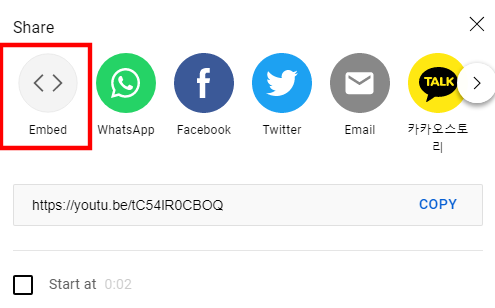
3. After selecting it, a window with text similar to the one below will open, from which you must copy the part of the youtube page that is in quotation marks.
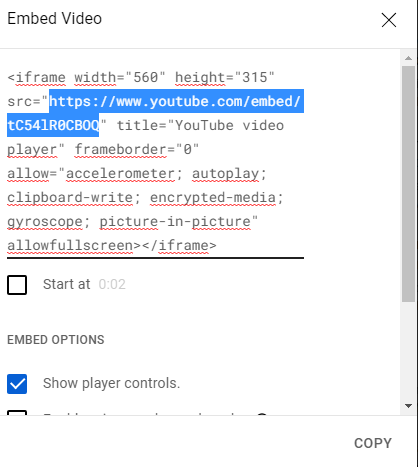
4. You then paste the page into the URL box in the options when creating the page Iframe in platform

5. As a final step, save the new component you created
5.6. Scheduler
When you open the Performance Dashboard, the Scheduler icon appears on the top bar. This tool allows you to schedule the setting of a selected device parameter to a specific value. A typical example might be resetting the counter. Scheduling can be one-time or periodic. In periodic scheduling, the recurrence period is set in the parameter format for Cron, known from Linux systems. The Scheduler window consists of two parts – on the left is a dialog for creating a new scheduler or editing an existing one, and on the right is an overview of created schedulers.
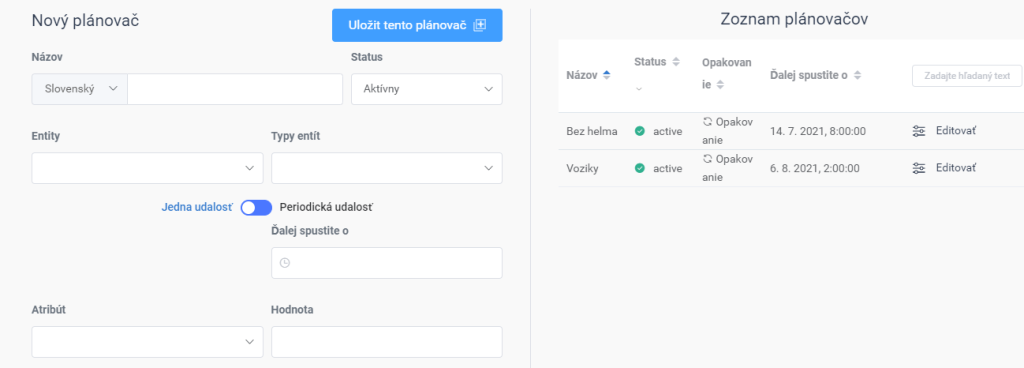
The scheduler parameters are:
| Name | Username for the given scheduler. |
| Status | Scheduler status setting (active / inactive). |
| Entities | Select the device to which the scheduler applies. |
| Entity types | Device type selection (entity type). The entity type filters the attributes to display only for the options of that entity type. |
| Repetition | Recurrence switch – single / periodic event. |
| Period | For a periodic event, it is a recurrence period in the parameter format for Cron. |
| Next run | In the case of a one-time event, the definition of the execution time. For periodic shows the next execution. |
| Attribute | Select the device parameter to be set by the scheduler. |
| Value | The value to which the parameter is to be set. |
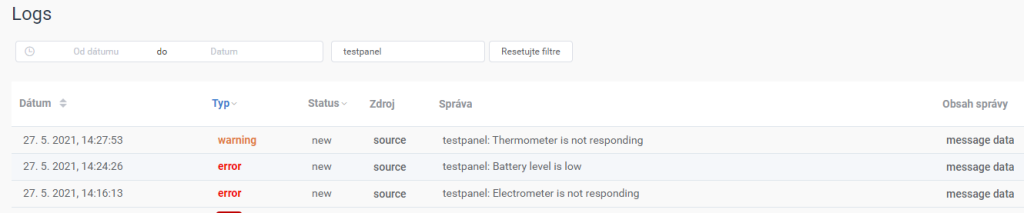
6. The Logs & Events application
The Logs & Events application is used to collect notifications from the platform and devices. The application includes a tabular overview of notifications with a filter. Displayed notifications can be filtered by date (range from / to) and it is also possible to search for text in notifications. Within the overview table, each notification has the following parameters:
| Date | Date of dispatch of the notification. |
| Type | Represents the notification level: values are available – Debug, Info, Notice, Warning, Error, Alert, Emergency and Critical. It is possible to set the filter according to the type of notification. For the average user, types from the Warning value are essential. |
| Status | Notification processing status identifier – values new, seen and done. |
| Source | Origin of notification – click to display a window with the sender’s details. |
| Message | The content of the notification itself. |
| Message data | Extension data to the message – parameters. |
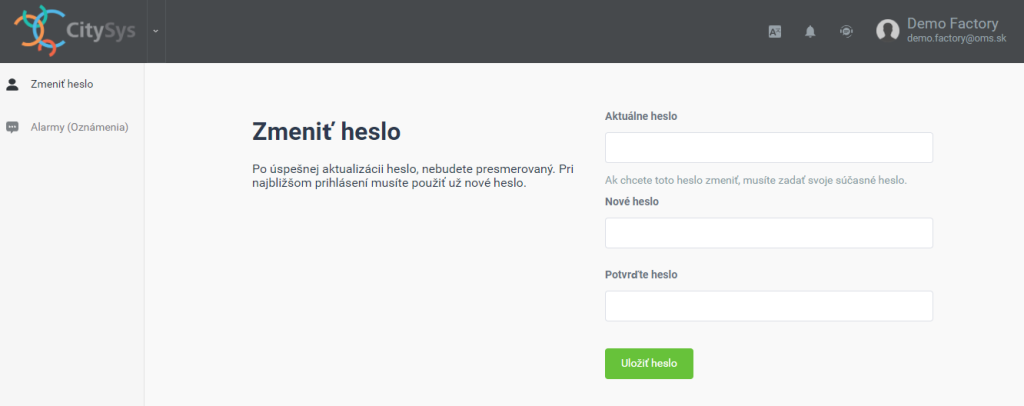
7. User settings
7.1. Change password
Within the user settings, it is possible to change the login password for the currently logged in user. To change the password, you must enter the current password, and then enter the new password twice. The change is confirmed by the Save password button.
7.2. Notifications
The notification section allows you to set the sending of an alarm notification to a defined e-mail address or via SMS to a given telephone number. The introductory view shows an overview of the set notifications. A new notification can be added via the Add notification button.
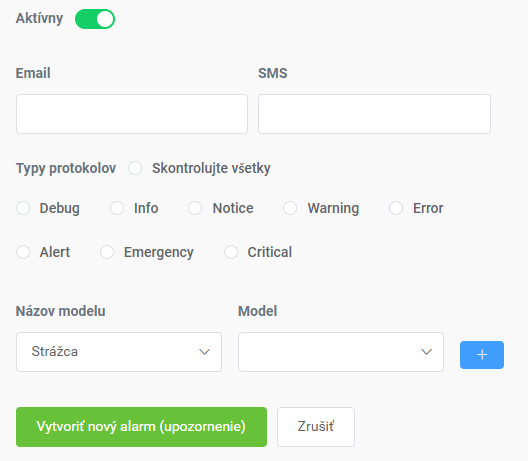
Within the notification parameters, an email address or telephone number for the SMS message is defined. You can then indicate the type of messages from the Logs & Events application to be forwarded. It is also possible to add alarms to the notifications – it is necessary to select the Alarm model and then select a specific alarm name. The setting is confirmed with the Create new notification button.
8. CitySys application – Public Lighting
This chapter describes a specific application of the CitySys platform for the needs of monitoring and control of public lighting. As public lighting is one of the basic parts of the Smart City concept, the individual components of the application are described in detail.
8.1. Public lighting – Types of equipment
The concept of public lighting control assumes three basic types of equipment:
- electrical distribution box – EDB
- public lighting line (also referred as EDB Line in the platform)
- street luminaire
8.2. Public Lighting – EDB
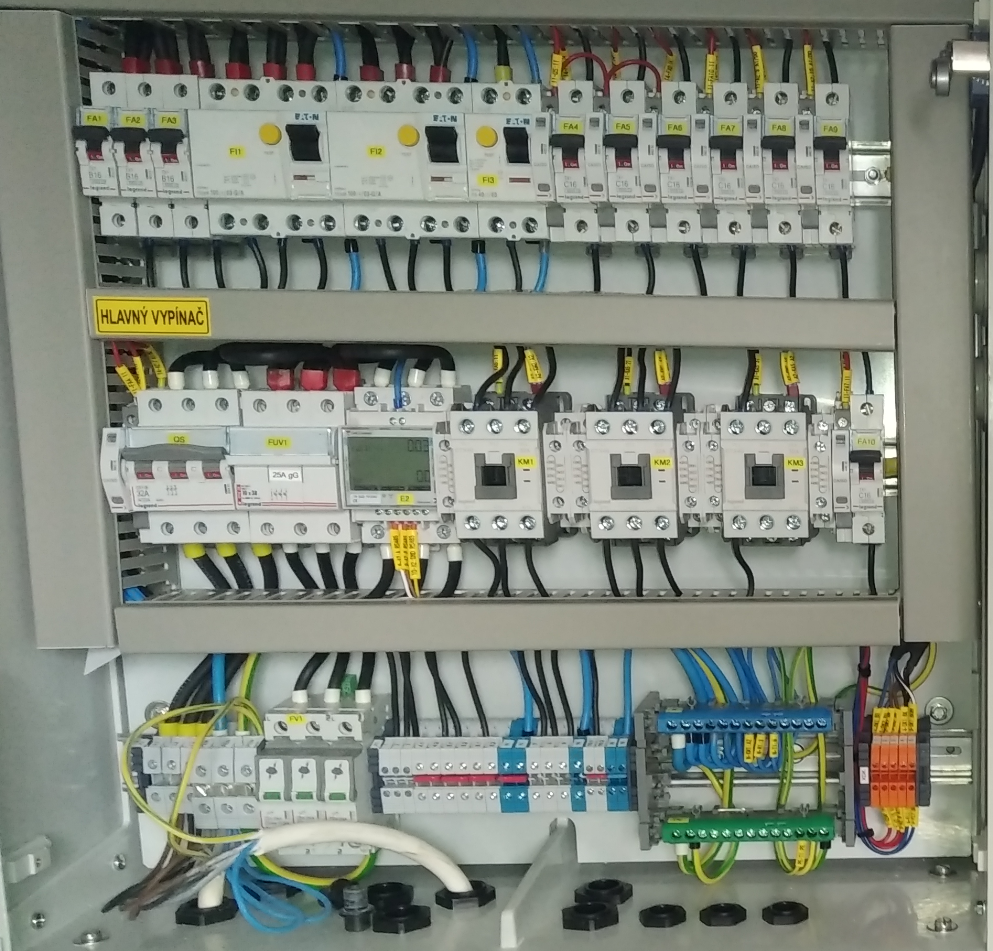
The public lighting switchboard (EDB) represents the logical core of the local public lighting system. Each city contains several EDBs, with several (usually 3) outlets (lines) on each EDB, and street lights on each line. This definition describes the tree structure of a public lighting system. EDB is a comprehensive device that contains elements for securing, monitoring and controlling the public lighting system. The native device for EDB is EDB CitySys, which consists of a power and control part. The power part of EDB CitySys contains:
- Input phase terminals (L1; L2; L3)
- Main switch
- 3-phase fuse disconnector
- Surge arrester
- Electricity meter with Modbus communication module
- Contactors of individual lines (resp. Phases: L1, L2, L3)
- Circuit breakers
- Circuit breakers and signal auxiliary contacts of individual lines.
- Door contact
- Door contact connection terminals
- Bus “N” and protective “PE” conductor
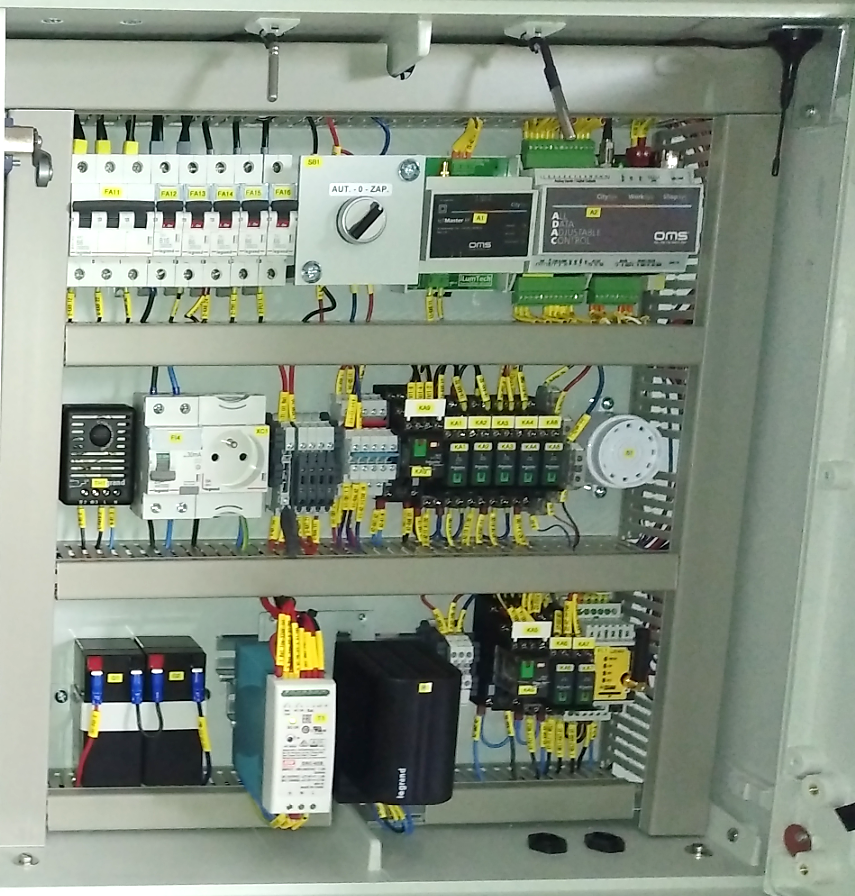
The control part of EDB CitySys contains:
- Communication unit disconnector
- Circuit breakers for 24 VDC power supply and 230 VAC service socket
- IoT MASTER communication unit
- Control unit
- Heating thermostat
- Service socket 230 VAC
- Fuses 24 VDC
- Relays – switching on contactors and sirens
- Siren
- 24 VDC backup control circuit batteries
- 24 VDC power supply
- Heating of the control unit
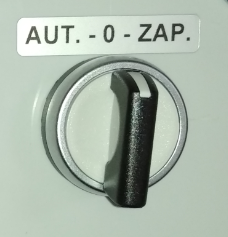
EDB CitySys is designed so that the rotary switch can be used to manually set the operating mode:
- automatic – control by Control unit
- off (0, OFF) – outputs are permanently disconnected
- on (manual) – outputs are permanently on
On the platform, EDB CitySys is displayed under its icon and entity type Electrical Distribution Box:
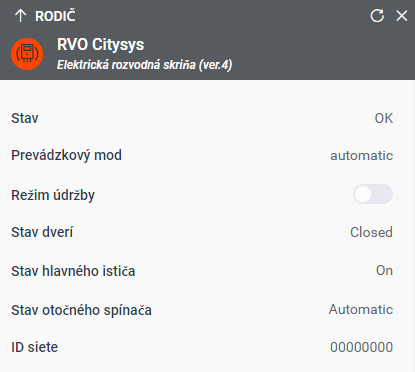
These parameters can be found in the EDB detail:
| Status | EDB status – values OK, NOK, OFFLINE (if it does not communicate for more than 10 minutes) or virtual (device without links to the real switchboard). |
| Power mode | Current EDB mode – automatic, manual, maintenance or off values. |
| Maintenance mode | Maintenance mode switch for EDB. |
| Door condition | Current status of the door contact – Open / Closed values. |
| State of main switch | Current circuit breaker status – On / Off values. |
| Master node version | FW version of the communication unit for luminaires. |
| EDGE-Firmware Version | FW version in the control unit. |
| Electricity meter data | The electrometer provides the following measurements: Total actual power [W], Consumed energy [kWh], for each phase: actual voltage [V], current [A], power [W], power factor [-]. |
| Twilight sensor | Measured lighting value in lux. |
| Temperature in EDB | Temperature measured inside the EDB in the control unit. |
| Number of lines, Breakers, Clamps and Contractors | EDB configuration parameters in terms of number of elements. |
8.2.1. Public Lighting– EDB – operating modes
The EDB operating mode is determined by the EDB maintenance mode setting via the platform and also by the current status of the rotary switch in the EDB. The table below defines possible EDB operating modes:
| Rotary switch status | Maintenance mode | Operating mode |
|---|---|---|
| Automatic | Off | Automatic |
| Automatic | On | Maintenance |
| Off | On/Off * | Off |
| Manual | On/Off * | Manual |
The EDB operating mode defines its behavior and capabilities. The modes are explained in the table below:
| Operating mode | Description |
|---|---|
| Automatic | EDB is controlled by the configuration of parameters from the platform. Lines are controlled either manually via line switches or using automatic time profiles. In this mode, the platform has an impact on the switching of the contactors, therefore in this mode no work may be done on the EDB or on the connected lines and luminaires. When the EDB door is opened, a warning siren is activated. |
| Maintenance | Automatic processes are suspended, but the platform still has an impact on switching the contactors. When the EDB door is opened, the siren is not activated, and opening the door is not considered an error condition. By activating the maintenance mode, the status of the contactors does not change. EDB maintenance is possible in this mode, but Off mode is recommended when working on connected lines and luminaires. |
| Off | EDB is manually (physically) switched off (shut down). The rotary switch ensures permanent disconnection of the contactors regardless of the status of the control signals from the platform. In this mode, full maintenance of the EDB and the connected cables and luminaires is possible. It is recommended to turn off all circuit breakers at the same time. |
| Manual | EDB is manually (physically) turned on. All lines have contactors on regardless of the status of the control signals from the platform. At the same time, the IoT Master communication unit is disconnected – thus the luminaires go into the switched-on state even in the case of the set profiles. This mode is used to test the luminaires before installation and as an emergency switching on of the lighting in case of a fault on the control unit. When activated for more than 5 minutes, the luminaires will be logged out of the communication unit in the EDB. |
Activating the maintenance mode will allow access to the EDB (door opening) without activating the siren.
8.2.2. Public lighting – EDB – conditional coloring
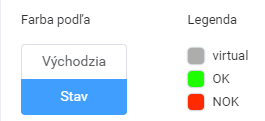
The EDB device allows to set the conditional coloring on the map base according to the following parameters: Status, Power mode and Door condition. The color schemes are as follows:

8.2.3. Public lighting – EDB – NOK status condition
Because EDB is a complex device containing many elements, the NOK condition can be triggered for a variety of reasons. In general, the NCA will arise in a situation where the EDB requires maintenance attention because an element is not working properly and could result in a malfunction of the public lighting or damage to the EDB. The table below documents the reasons for the NOK condition:
| Event | Severity level |
|---|---|
| Door open out of maintenance mode | Warning |
| Dropped main circuit breaker | Critical |
| The IoT Master communication unit does not respond | Alert |
| The Electrometer does not respond | Error |
| Power failure on one of the phases | Critical |
| Battery error | Error |
| Power supply error | Alert |
| The thermometer does not respond | Warning |
To identify the specific cause of the NOK condition, it is recommended to look in the Logs & Events application, where there will be a notification about the event that caused the NOK condition, together with a description of the event. Another option is to decode the Status Code value, which directly identifies the causes of the NOK status.
| Bit (0=LSB) | Parameter | Status for 1 | Status for 0 | Status for 10 | Status for 11 |
|---|---|---|---|---|---|
| 0 | Main circuit breaker | Off | On | – | – |
| 1-2 | Power mode | Manual | Automatically | Turned off | Maintenance |
| 3 | Door contact | Open | Close | – | – |
| 4 | Electricity meter condition | NOK | OK | – | – |
| 5 | Thermometer condition | NOK | OK | – | – |
| 6 | Battery level | NOK | OK | – | – |
| 7 | Power supply status | NOK | OK | – | – |
| 8 | Master Node Status | NOK | OK | – | – |
| 9 | Phase voltage failure | NOK | OK | – | – |
8.3. Public lighting – Line
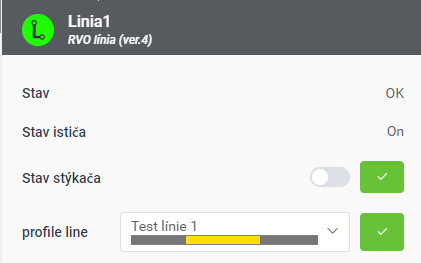
The line represents one EDB terminal, which is controlled by a specific contactor. In the real embodiment, it can be one single-phase terminal, but also a three-phase terminal, in the case of several terminals connected to the same contactor. In a tree structure, a line is nested into an EDB as an object and may or may not be located on a map. Among the parameters of the line are also the characteristics of the line of the given line. Within the parameters that determine the state of the line, the following are important:
| Status | Line status – OK or NOK values. |
| State of breaker | Current state of the line circuit breaker – values On / Off. |
| State of contactor | Current status of the line contactor and at the same time its switch – values On / Off. It can be manually controlled from the platform. |
| Profile line | Currently set line profile. Its course is graphically represented. It can also be set in maintenance mode. |
The device of the line also allows to connect a secondary electricity meter and within the parameters it is therefore possible to monitor the electrical parameters of the line. In the basic form, however, the line does not contain an electricity meter. The state of the line is determined by only one condition – the state of the circuit breaker. If the circuit breaker is tripped, the state of the NOK line. Conditional coloring only supports coloring by status:
Line control from the platform is possible in two ways: manually or automatically. In both cases, it is necessary to activate the maintenance mode on the top bar. Subsequently, the Contactor Status and Line Profile elements are activated. Clicking the radio button will change its status. Sending the settings to the line must be confirmed by pressing the green button and then in the confirmation window. Similarly, for a line profile, by clicking in the profile field, it is possible to select from the list of created profiles Public lighting – Profiles. The sending is also confirmed by pressing the green button. Confirmation of order execution can also be found in the Logs & Events application.
8.4. Public lighting – Street Luminaire
A street luminaire is the terminal equipment of a public lighting system. In a real implementation, it can be any luminaire that contains a CitySys IoT Node with PLC, RF or Cellular technology. CitySys IoT Node is a control unit located inside the luminaire or via a NEMA / Zhaga socket on the luminaire. Schematically, the CitySys IoT Node is located between the power supply in the public lighting pole and the ballast in the luminaire. As it has an integrated relay, it allows the phase to be physically disconnected from the ballast. Using the DALI interface, the luminaire can be dimmed to control consumption and brightness. The CitySys IoT Node is also equipped with an integrated electricity meter and tilt sensor.
In the tree structure of the device, the luminaire is typically located below the line and below the EDB.
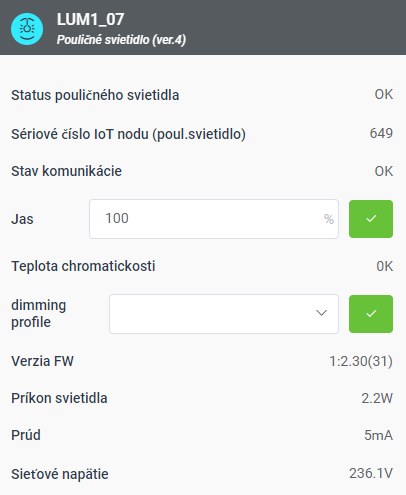
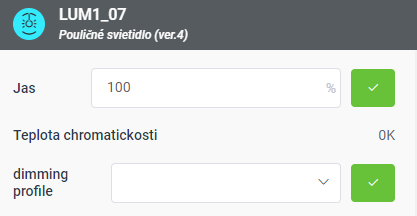
These parameters can be found in the detail of the luminaire:
| Status | Lamp status – OK, NOK or OFFLINE values. |
| SN(IoT Node – street luminaire) | The address of the luminaire for communication purposes is located on the IoT node label. |
| Status of communication | Current status of the communication line. |
| Brightness | Current state of luminaire brightness – values 0 – 100%. It can be changed manually. |
| Correlated Color Temperature | Characteristics of the light source. As standard, it is a constant, but it is possible to have a lamp with an adjustable color (tunable white). |
| Dimming Profile | Currently set luminaire dimming profile. Its course is graphically represented. It can also be set in maintenance mode. |
| FW version | FW version in the IoT Node control unit. |
| Electricity meter data | The Electricity meter provides the following measurements: energy consumed [kWh], actual voltage [V], current [A], power [W], power factor [-], frequency [Hz]. |
| Temperature | Current temperature in the control unit [° C]. |
| Inclination X, Y, Z-axis | Tilt measurement in individual axes. |
| Lifetime of lamp | The total time the IoT Node was energized. |
| Actual time, Sunrise and Sunset time | Time parameters of internal clocks and astro-hours for profiles on the luminaire. Synchronization is provided by the control unit in the EDB. |
The control of the street luminaire is similar to the line. You must first activate the maintenance mode for the lighting. Subsequently, the control elements for brightness and dimming profile are activated. For brightness, it is possible to set the value from 0 to 100%, where 0 represents the switched off luminaire and 100 represents the full power of the luminaire. The dimming profile is selected from the list of created dimming profiles. The setting is confirmed by the green button and then in the confirmation window. Confirmation of order execution can also be found in The Logs & Events application.
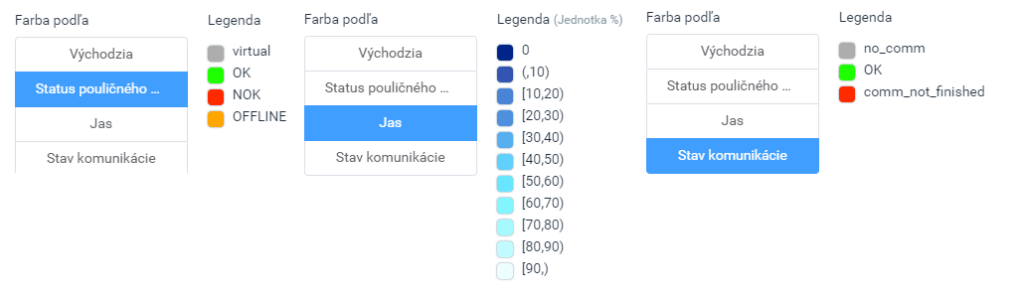
8.5. Public lighting – Street luminaire – coloring
The Street Luminaire device allows you to set the conditional coloration on the map base according to the following parameters: Status, Brightness and Communication status. The color schemes are as follows:
8.6. Public lighting – Profiles
The Profiles tool is used to create and manage switching and dimming profiles for automatic lighting control. Switching profiles are designed for lines – this means that only two states can be assigned to individual time points: on or off. According to the switching profiles, the line contactors are controlled and are therefore superior to the dimming profile. Dimming profiles are designed for luminaires (compatible with CitySys IoT Node) and allow automatic control of luminaire brightness according to time. It is possible to assign a brightness value from 0 to 100% to the individual time points. The profiles themselves are created without binding to the final EDBs. The same profile can therefore be assigned to different lines and luminaires on different EDBs. When using astro hours, the real times of twilight and dawn within the EDB are always recalculated according to its current GPS coordinates. The Profiles tool opens when you click the Profiles icon in the top bar. This icon is only available if maintenance mode for lighting has been activated. The Profiles window then pops up from the top bar.
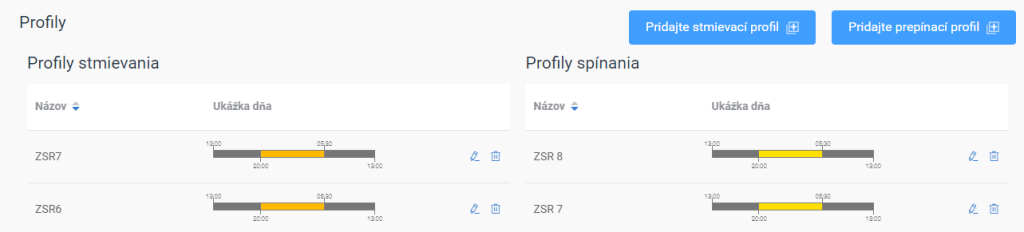
The window is divided into two parts: on the left are dimming profiles (for luminaires) and on the right are switching profiles (for lines). The tables show an overview of already created profiles with a name and a sample of the course, where black represents the off state and shades of yellow and orange the on state. With the dimming profile, yellow represents 100% brightness and orange brightness 10%. You can create a new profile using the buttons at the top right, and you can edit an existing profile by clicking the pencil icon next to the profile. In both cases, the same profile editing window opens.
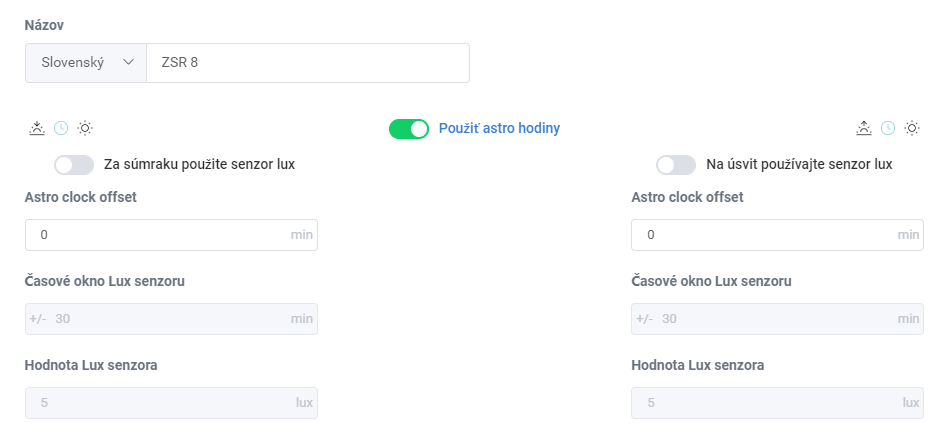
The upper part of the window is common for dimming and switching profiles. The profile parameters are as follows:
| Name | User profile name. It is also possible to enter name translations. |
| Use astro clock | Astro clock switch. When turned on, the profile is limited by the time of dusk and dawn. |
| Use a lux sensor for dusk / dawn | Light sensor use switch for combined profile. Switches are only available when astro clock is activated at the same time. |
| Astro-clock shift | The value by which the current twilight / dawn time is shifted. Negative values are also possible. |
| Lux sensor time window | The size of the time window around the twilight / dawn time in which the light sensor has priority. |
| Lux sensor threshold | The value from the light sensor, exceeding which triggers the switching on (twilight) or the switching off (dawn) of the profile. |
At the bottom of the window is a graphical tool for creating profile points:
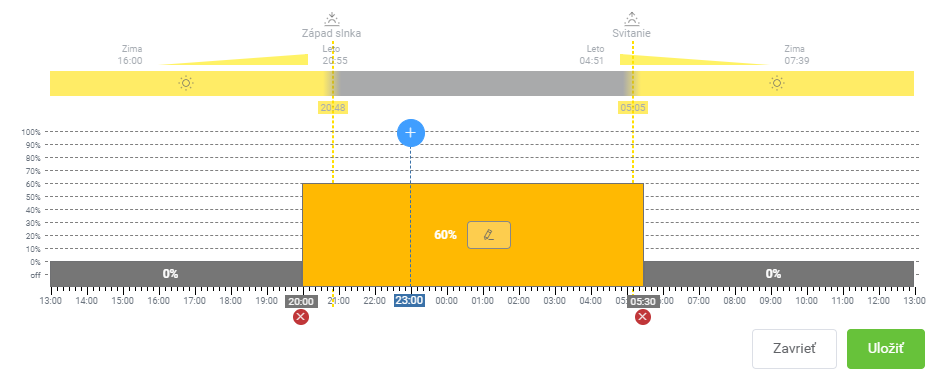
This part is already different for dimming and switching profiles. For switching profiles, only two values ??can be set in each interval using the on / off switch. For dimming profiles, you can adjust the brightness level in percent by dragging the top of the interval rectangle. At the same time, the color of the rectangle changes from yellow (100%) to dark orange (10%). The blue circle with the white + mark is used to create a new interval. You can adjust the position of the new interval by dragging the blue wheel and timeline connector. This is created by clicking on the blue wheel, in such a way that the existing interval is divided in the current position of the blue wheel. Subsequently, it is possible to change the time limits of the intervals by moving the sides of the intervals to the right / left. There can be a maximum of 16 intervals within one profile. Intervals can also be removed using the red wheel with the white cross below the timeline. The boundary between the intervals disappears in such a way that the interval to the left of the boundary “absorbs” the interval to the right of it. For dimming profiles, it is also possible to set the chromaticity temperature (CCT) level within the interval by clicking on the pencil icon within the interval rectangle. Using the scroll bar or the text box, you can enter the CCT, which is then indicated by highlighting the pencil icon. Only a special type of luminaire supports CCT change. For classic monochrome, this parameter is ignored. An important parameter is the astro clock switch. When turned off, the profile behaves exactly according to the graphic design and preview every day of the year. When activating the astro clock, the point at which the line turns on is added at twilight and the point at which the line turns off at dawn. This means that even if the profile interval starts at 19:00, for example, if it is twilight at 18:30, the line will start at 18:30. However, if the situation is the opposite and the profile interval starts at 18:30 with the on state, then this point is executed and the twilight point at 19:00 does not manifest itself in any way (transition from on to on state). Therefore, for the correct function of the astro clock (twilight on, dawn off), there should be no on point before dusk, and an off point for dawn – unless this function is required. Astro clocks work correctly even in the basic form, when a single interval with an off state is defined (from 13:00 to 13:00). The intervals between twilight and dawn are not affected by astro hours. The current time of dusk / dawn depends on the day of the year and the position of the EDB. Therefore, different EDBs have different switching times depending on the longitude of their position. Twilight / dawn time can be statically shifted statically (every day of the year) using the Astroclock Shift parameter. The parameter can be set in minutes as a positive or negative number. Another way to influence twilight on or dawn off on a line is to use a light sensor. Based on the values ??from its measurement, the EDB decides when within the time window of the light sensor it actually turns on or off the line. turns off. For example, at dusk, when the threshold value of the light sensor is set to 100 lx, if the measured value falls below 100 lx, the line will be switched on at a time other than the calculated twilight time. This only applies within the time window around the calculated twilight / dawn time. If in this example the measured value does not fall below 100 lx even after the time window has elapsed, the line will be switched on, because at that point the astro hours already have priority. The behavior at dawn is analogous with the difference that the measured value must be greater than the threshold and the line switches off. To save the profile, press the Save button. An existing profile can be deleted using the trash can icon next to the profile. After creating a profile, it is then possible to assign it to a line or luminaire via the detail of the device..
8.7. Public lighting – Logs & Events
EDB CitySys sends event notifications to the platform. These are various fault conditions, their elimination, but confirmation of commands from the platform. They are used to quickly check the status of the EDB or identify the error condition. The table below contains all messages with a description. Notifications highlighted in orange are associated with the invocation of the NOK state of the EDB, which represents a state where the EDB does not work correctly.
| 1 | Switching profile point applied to line no. x | Informational | Applied point of the switching profile on line no. X. |
| 2 | Dusk has occurred: | Informational | Twilight has come, the value of twilight time. |
| 3 | Dawn has occurred: | Informational | Dawn has occurred, dawn time value. |
| 4 | Dimming profile was successfully received by node no. x | Notice | The dimming profile was successfully received by node no. X. |
| 5 | Master node is responding again | Notice | The master node started responding again. |
| 6 | A command was sent from terminal interface | Debug | A command was sent from the terminal. A command to the luminaire was sent from the EDB’s internal interface. |
| 7 | Master node is not responding | Alert | The master node is not responding |
| 8 | Configuration of dimming profile to node no. x has failed | Alert | Dimming profile configuration for node no. X failed. |
| 9 | Circuit breaker was turned on – line no. x | Notice | Switching on the circuit breaker on line no. X. |
| 10 | Circuit breaker was turned off – line no. x | Error | Switching off the circuit breaker on line no. X. |
| 11 | Dimming profile was processed for node no. x | Informational | The dimming profile was processed for node no. x. |
| 12 | The dimming profile was successfully received by node no. | Notice | Notification of successful receipt of the profile by the luminaire. |
| 13 | Switching profile was processed for line no. x | Informational | The switching profile was processed for line no. x. |
| 14 | Thermometer is not responding | Warning | The thermometer in the EDB does not respond. |
| 15 | Thermometer is responding again | Notice | The thermometer in the EDB responds again. |
| 16 | Main switch has been turned off | Critical | The main power switch has been turned off. |
| 17 | Main switch has been turned on | Notice | The main power switch has been turned on. |
| 18 | Power supply has disconnected input | Alert | The power supply has no input voltage. |
| 19 | Power supply works correctly | Notice | The power supply is working properly. |
| 20 | Battery level is low | Error | The battery has a low voltage level. |
| 21 | Battery level is OK | Notice | The battery has the correct voltage level. |
| 22 | Door has been open | Notice | The door was open. |
| 23 | Door has been closed | Notice | The door was closed. |
| 24 | Door has been open without permission – alarm is on | Warning | The door was opened without permission – the siren was on. |
| 25 | State of contactor for line no. X is | Informational | Contactor status for line no. X is. |
| 26 | Electrometer is not responding | Error | The Electrometer does not respond. |
| 27 | Electrometer is responding again | Notice | The Electrometer answers again. |
| 28 | No voltage detected on phase no. X | Critical | For phase no. X is not a voltage. |
| 29 | Voltage on phase no. X has been restored | Notice | Voltage on phase no. X has been restored |
Notification messages can be used directly to diagnose EDB. The table below describes and suggests the procedure for the occurrence of a given notification:
| 1 | Applied point of the switching profile on line no. x – used to check the course of the switching profile with a specific time stamp. |
| 2 | Twilight has occurred, twilight time value – used to check the course of the switching profile with a specific time stamp. |
| 3 | Dawn has occurred, the value of the dawn time – it is used to check the course of the switching profile with a specific time stamp |
| 4 | The dimming profile was successfully received by node no. x – – is used to control the transmission of the profile towards the luminaire. |
| 5 | Master node started responding again – notification of troubleshooting with Master node. |
| 6 | A command was sent from the terminal. A command to the luminaire was sent from the EDB’s internal interface – a notification that someone had used this interface. |
| 7 | Master node does not respond – unable to communicate with communication unit. Check the unit circuit breaker, the status of the LEDs and the communication wires between the Master node and the control unit. If the problem persists, contact the service organization. |
| 8 | Dimming profile configuration for node no. X failed – there was a problem sending the profile to the light. Make sure the light is on and communicating, or resend the profile. If the problem persists, contact the service organization. |
| 9 | Switching on the circuit breaker on line no. X – information about line circuit breaker tripping. |
| 10 | Switching off the circuit breaker on line no. X – check the condition of the circuit breakers and ensure that they are switched on. In case of repeated shutdown, eliminate the problem on the line (short circuit or high consumption). |
| 11 | The dimming profile was processed for node no. x – information for checking the sending of the profile from the platform to the control unit. |
| 12 | Notification of successful reception of the profile by the luminaire – information for checking the sending of the profile from the control unit to the luminaire. |
| 13 | The switching profile was processed for line no. x – information for checking the sending of the profile from the platform to the control unit. |
| 14 | The thermometer in the EDB does not respond – check the connection of the thermometer to the control unit. If the problem persists, contact the service organization. |
| 15 | The thermometer in the EDB responds again – information that the problem with the thermometer has been eliminated. |
| 16 | The main switch has been switched off – check the status of the main switch and make sure it is switched on. In case of repeated switch-off, eliminate the problem on the line (short circuit or high consumption). |
| 17 | The main switch has been turned on – information about switching on. |
| 18 | The power supply has no input voltage – check the power supply supply for the control unit. Either the circuit breaker is tripped, the cable is broken or there is a power failure (mains voltage). If the problem persists, contact the service organization. |
| 19 | Power supply is working properly – Learn how to troubleshoot the power supply. |
| 20 | The battery has a low voltage level – check the battery connection and the voltage at its terminals. If the problem persists, replace the battery or contact a service organization. |
| 21 | The battery has the correct voltage level – battery troubleshooting information. |
| 22 | The door was opened – information on the opening of the EDB door during maintenance mode. |
| 23 | The door was closed – information on closing the door. |
| 24 | The door was opened without permission – the siren was on – the door was opened out of maintenance mode. Close the door or activate maintenance mode. |
| 25 | Contactor status for line no. X is – information about the change of contactor status for the line. |
| 26 | The Electrometer does not respond – check the power supply of the electrometer (display light) and the connection of the RS485 bus cables to the control unit. If the problem persists, contact the service organization. |
| 27 | Electrometer Responds – Information on how to troubleshoot the electrometer. |
| 28 | For phase no. X is not voltage – check the phase supply to the electricity meter, or check the main circuit breaker of the consumption point. If the problem persists, contact the service organization or check the current status of electricity distribution at the given point of consumption. |
| 29 | Voltage on phase no. X has been restored – – voltage troubleshooting information. |
9. Reports
9.1. Reporting defects to users
The provider provides a guarantee for all services provided for a period of 24 months. The warranty period for the performed services begins on the day of signing the acceptance protocol. The warranty period will be extended by the time period during which the service or its part was claimed, by the time from the date of the justified complaint until the removal of the claimed defect. If the customer finds a defect in the service provided, he is obliged to notify the provider of this fact without undue delay in writing – in electronic form through HELP DESK. Such notification shall include the identification of the defect, its location and a description of the defect. The customer is obliged to provide all necessary cooperation, in particular to allow the provider access to the place of occurrence of the defect. The provider is obliged to eliminate the detected and claimed defects of the provided service free of charge within 7 days from the date of delivery of the notification of the defect by the customer, unless the parties agree in writing on a different period in a specific case. The provider is obliged to eliminate every claimed defect, ie. even one in which it is not possible to determine with certainty who is responsible for the defect. In the event that during the elimination of the defect or after the elimination of the defect, it is proven that the provider is not responsible for it, the provider is entitled to reimbursement of purposefully incurred costs in connection with the elimination of the defect. In the event that the provider does not rectify the claimed defects within the agreed period, despite the fact that the customer has created the conditions for their removal, the customer has the right to remove the defects at the provider’s expense or entrust a third party at the provider’s expense without the provider’s consent. The assertion of a claim for liability for defects by the customer does not preclude the assertion of a claim for compensation for damage caused to the customer by the defect.
[…] https://help.iotsys.space/citysys/en/user-manual-citysys/ […]